Mobilizing our volunteers to support the MSF GIS Unit
From the first days of the Covid-19 crisis in March 2020, a team was mobilized at CartONG to support the MSF GIS Unit and respond to the newly emerging logistical, HR and supply chain needs of Médecins Sans Frontières (MSF) as the organization was reorganizing its operations in response to the pandemic.
In particular, it soon became vital for MSF to stay informed in real time of the evolution of measures at the borders of the 70 countries in which the organization was operating, and of access conditions for airways and roads, so as to be able to maintain its projects underway worldwide. Additionally, MSF required support with managing its human and logistical resources as the outbreak was spreading rapidly and the organization needed to be increasingly reactive.
This situation led for the first time ever at CartONG to a wide coordination between the staff and volunteer teams in support of the MSF GIS Unit.
Development of a first dashboard within a few days
Within a few days of activation, CartONG’s web development team set up an online dashboard using Ops Dashboard from ESRI. The dashboard displayed information on travel restrictions and quarantine measures per country, as well as on international airport statuses and constraints on the MSF supply chain that could be updated daily and in part, automatically, thanks to data gathered by a team of CartONG’s volunteers.
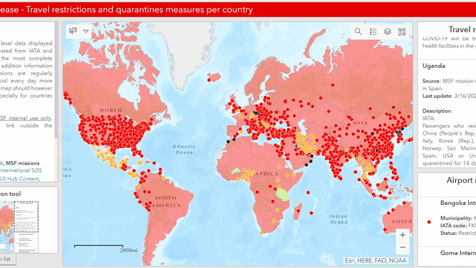
Legend: first version of the dashboard developed by CartONG in support of the MSF GIS Unit
In a second phase of the project, as the demand had evolved with the introduction of more complex features, CartONG moved away – in collaboration with MapAction and the MSF GIS Unit – from the ESRI solution and created a custom-based platform built with vue.js and openlayer acting as a centralized COVID-19 response for MSF from a data and GIS perspective.
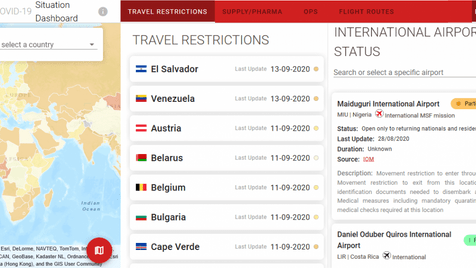
Legend: custom-base version of the dashboard developed by CartONG in support of the MSF GIS Unit
A project made only possible by the dedication of CartONG’s volunteers!
The choice was quickly made to involve volunteers to be in charge of the updates, so that the staff team could concentrate on providing advanced technical support to MSF.
This was the first time at CartONG that a project gathered such a large contingent of volunteers over such a long period of time, with more than 20 people coming from more than 10 countries involved for several months in the first part of 2020! Given the scope of the task at hands, CartONG even decided to recruit a coordinator to manage and support the volunteer team – another first for our organization!
“I really enjoyed the sense of community that it provided and the regular updates from everyone.” Hannah-Rose
Why did CartONG volunteers’ support entail and why was it key for the project?
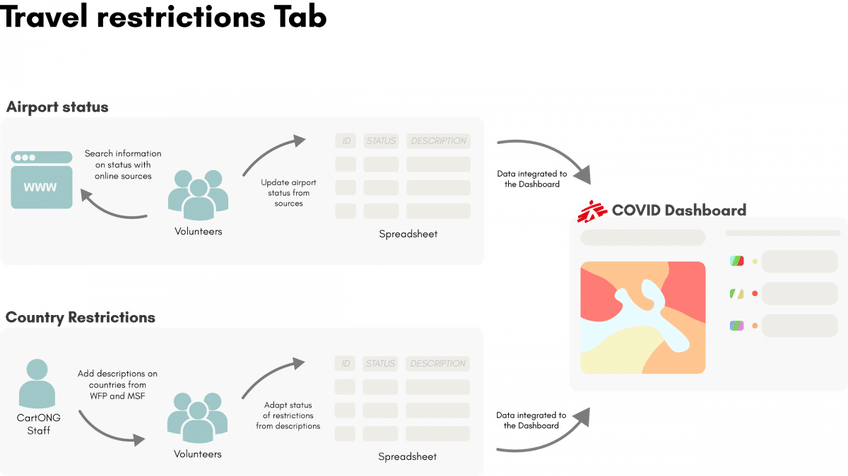
The work of the volunteers involved updating the data feeding the travel restrictions tab of the dashboard – a set of information that was evolving constantly in the first few weeks of the pandemic and which needed to be cross-referenced and compiled from different sources, all in all, a very time-consuming process. At first, the updates were done on a daily basis by volunteers. After a few months, we moved to a slower rhythm of twice per week – which still required a lot of time and dedication front the team.
“This mission gave me another insight into the work of MSF. I was really happy to see the final product aka the dashboard” – Frantisek
Coordination was done via Skype and each volunteer was in charge of his/her own list of countries to monitor. More specifically, volunteers were asked to keep updating the information on: i) country restrictions – to know which air spaces were closed and which ones were still open; as well as ii) airport status – to know which types of flights were still operating between passengers, cargo, and humanitarian flights. The information was centralized in an Excel file which was then integrated into the online dashboard. After a few weeks, part of the workflow had been automated using python script.
The data mining and data checking work conducted by the volunteers made it possible for the dashboard to have the most up-to-date data, which was absolutely key for MSF at the time. As no unique date source could be identified in the early days of the outbreak, this project acted as a complete springboard and was in fact needed for the dashboard to support the MSF’s teams to its full potential.
“I want to thank you all for the hard work you have been doing throughout those months to maintain some key information updated, namely airports and country restrictions […] The work accomplished is highly appreciated within MSF and used on a daily basis by our supply, HR, Med and Ops teams” – Audrey Lessard-Fontaine, Head of the MSF GIS Unit (June 2020)
A unique experience
The coordination between CartONG and its team of volunteers, MapAction and MSF very much demonstrated the ability of our organization to respond with dynamic tools and resources in times of crisis. What’s more, we are incredibly grateful to our volunteers for having answered present for this project. A huge thank you to all the volunteers that were involved!