Identifying malnourished children in refugee camps
In 2020, CartONG worked on improving the mobile data collection tools used in the Standardized Expanded Nutrition Surveys (SENS) conducted by UNHCR and its partners in refugee camps and settlements worldwide. In particular, a significant part of our work consisted of improving the existing child form to better detect malnourished and anemic children.
What’s SENS?
Ensuring good nutritional outcomes in refugee populations is a priority for UNHCR. UNHCR programmes rely on having good data to deliver effective and timely interventions to improve outcomes. UNHCR’s Public Health Section has collaborated with multi-sectors to develop guidelines for the crucial collection of nutritional and health information from refugees, which is the UNHCR Standardised Expanded Nutrition Survey (SENS) guidelines, or more commonly called the SENS guidelines.
SENS guideline is a multi-sectoral survey tool which covers demography, nutrition, public health, food security, energy and WASH. It’s aimed at standardising the way annual nutrition surveys are conducted by UNHCR health and nutrition partners to provide high quality data. Based on the information provided by UNHCR on its website.
From the early days of SENS to today
CartONG has been supporting the mobile data collection (MDC) part of SENS starting as early as 2010. Ever since, our team has been looking for ways to improve the forms, to reflect new indicators and to calculate some of those indicators directly in the forms. Additionally, we were also searching to find ways of making administering the survey as user friendly as possible, as well as easing the life of the survey managers and enumerators by integrating some of the steps into a workflow that is manageable.
In 2020, a new version of SENS – SENS V3 – including a wide range of improvements not limited to the mobile data collection part was released by UNHCR (learn more here). On the MDC front, new functions were added to improve the quality of data. In particular, the child form now comes with improved flagging for moderate acute malnutrition and severe acute malnutrition conditions to ensure children are referred immediately.
SENS surveys are not so easy to implement
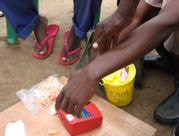
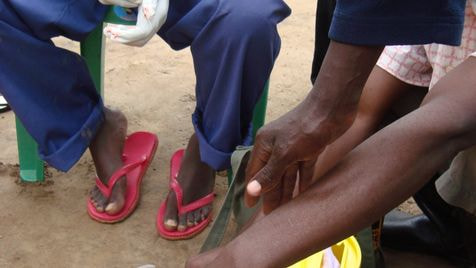
A SENS survey is logistically challenging, especially the part on collecting anthropometric measurements of children, as you need trained enumerators that are able to take height (when standing upright), length (when lying down), the MUAC (Middle Upper Arm Circumference) as well as the weight correctly. You also need staff which are able to take the Hemoglobin (which usually requires gloves, sterile tissues, needles for pricking the fingers and glass stents) as well as Hemocue machines to examine the Hemoglobin levels inside a drop of blood. Last but not least, you need to have enumerators being able to record the surveys and the results correctly into a mobile phone.
A key aspect of the survey process is that you want the team leader to get feedback and results as early as possible so that they can act on it – ideally in real time, such as referring sick children to the service, remeasuring the child with abnormal results, etc. As it stands, an intensive amount of training and training material is necessary to equip all the survey teams you will need to deploy a SENS. On average, you usually plan in 6 different survey teams, each composed of 4 to 6 survey team members, to conduct a SENS from start to finish.
An important tool to flag malnourished or anemic children
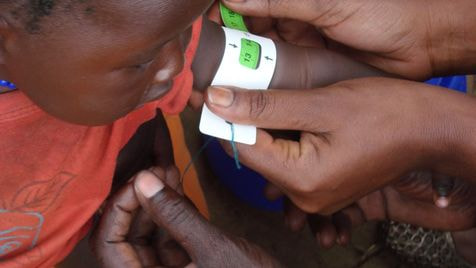
One of the main aspects when undertaking the survey is to flag children which might be anemic or malnourished and refer them to the treating program accordingly. For malnutrition, there are two criteria, weight-for-height z-score (WHZ) or MUAC plus the existence of pitting edema. The child will be defined with either moderate acute malnutrition (MAM) or severe acute malnutrition (SAM) by comparing its WHZ or MUAC to the cut-off. Pitting edema or a low MUAC which can already raise a flag on the mobile phone during the survey, while calculating weight-for-height z-score (WHZ) is always trickier. For the purpose of the survey, WHZ is usually determined through ENA, a computer-based program calculating the Z-Score, which allows an insight on whether a child is outside of the usual growth chart established for its age and gender. However, it’s not feasible to use ENA on site during surveys. The enumerators thus need to use a physical, multi-pages z-score table published by WHO to locate the proximate WHZ for each child, which is time consuming and bears both high systematic and personal error risks.
Working on improving the detection of malnourished and anemic children to increase referral rates
Robert Johnson from UNICEF was one of the first to implement an algorithm directly into the xls forms that would flag first extreme outliers and also detect some children plotting a Z-Score. It was not detecting all of the SAM and few of the MAM children. After discussing with him and staff from CDC who had piloted and tested the algorithms, our team decided to run the algorithms against a set of large real data and analyze it. Heqian Kuang, Associate Nutrition and Food Security Officer at UNHCR as well as Caroline Wilkinson, Senior Nutritionist, at the time at UNHCR, were spearheading this. CartONG, being no matter expert on nutrition and the respective algorithms used, focused on the analysis of large datasets when running modified versions of the algorithms. The key lies in applying not only different algorithms for boys and girls but also different algorithms based on the height/length and whether children were measured standing upright or lying down.
With the initial Excel file compiled by Robert Johnson and the Heqian Kuang’s testing of the mathematical curves and assessing the algorithms, the CartONG team was able to determine the best fitted polynomial for the Z-Score and improve the results for the Standard -3 deviation (SAM) but also the standard -2 deviation (MAM) which notates the moderately malnourished children. The modified Excel was published on Gitlab by Heqian Kuang (under development).
A successful modification
With this modification, out of a set of 17,500 children the number of children flagged for severe acute malnutrition (SAM) rose from 54 to 78 and for moderate acute malnutrition (MAM) from 2 to 541, whilst keeping the number of children erroneously flagged down to 46. The children which would come up as MAM or SAM after entering their measurements into ENA was at 647. Not to say it’s accuracy is far better than manually using a paper-based WHO z-score table. This was a great improvement! This means that enumerators would now receive a notification for those children and would be able to fill a referral form on the spot while already informing the parents that they should seek an appointment in the nutrition center. Once at the center, the children would then be re-measured and examined by health personnel and entered into the respective feeding programs. Overall, a simpler and more effective process for all.

Raising awareness on the new material to ensure its proper use in the field
Following the newly released version of SENS, UNHCR and CartONG ran a series of webinars on the SENS V3 forms in English and French this fall to sensitize nutritionists and raise awareness on the new material and what it can do. The 6 webinars covered the updates in SENS V3 guidelines as well as a presentation of the new MDC tools, and are available here.
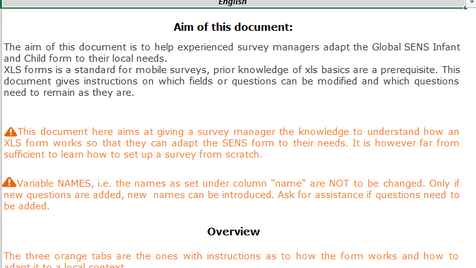
The SENS V3 forms can be downloaded (here). They are in XLSForm format (and their converted xml counterparts) and compatible with Kobo Server and ODK Aggregate. Additionally, they contain instructions on how to adapt some of the variables to local choices and specify which variables need to be kept to ensure that the indicators necessary can be derived from them and which variables are optional and could be left out if not required in the local setting.
Many thanks to CDC, UNICEF, as well as Heqian Kuang and Caroline Wilkinson from UNHCR for having supported this effort giving us the background, data and material to work on this.