CartONG’s work in support of the COVID-19 pandemic response

To learn more about the work we are doing in response to the COVID-19 crisis, we invite you to read this other article here.
– – – – –
The whole world’s attention is focused on one thing only at the moment: the COVID-19 pandemic. This is a crisis like no other we’ve ever seen before. On April 6th, 2020, the number of contaminated people worldwide was just shy of 1.3 million. More than 3 billion individuals are currently confined at home globally. And multiple, ongoing humanitarian, economic, social and environmental crises will be exacerbated by this pandemic.
CartONG is adapting its response and the support it provides to its partners and the sector as a whole thanks to the dedication of its staff and of its network of volunteers. We’ve witnessed an incredible response and we are extremely grateful to them (see the key figures here after one month of support). As needs evolve, we will continue to adapt the assistance we provide over the weeks and months to come. Here is a snapshot of what we have been doing so far.
In the last few weeks, we have tirelessly been working on data harvesting as well as creating dashboards and (web)maps, in particular in support of our partners MSF, UNHCR, Humanity & Inclusion and the RUSH initiative.
Extended support to MSF
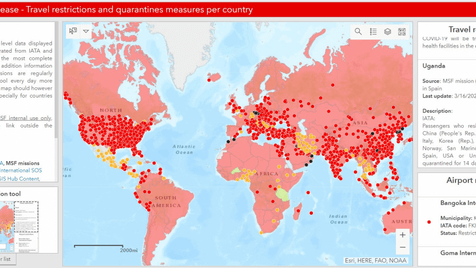
In the last few weeks, our usual support to the MSF GIS Unit has been drastically reconsidered so as to respond quickly to new emerging needs and requests due to the COVID-19 pandemic. So far, while some may assume that we have mostly been working with epidemiological data, we have in fact been concentrating our response on the logistical, HR and supply angle as MSF is reorganizing its operations and must be increasingly reactive.
We have thus developed a first dashboard displaying daily updated data on travel restrictions and quarantine measures per country, as well as on international airport statuses and on constraints on the MSF supply chain. To this end, we used the Ops Dashboard from ESRI as it is a ready for use tool, able to generate solutions that are operational in a matter of days. Now that the pilot has been shared internally and as the demand has evolved with the introduction of more complex features, we are also creating a custom-based platform acting as a centralized COVID-19 response for MSF from a data and GIS perspective.
In parallel, and due to the amount of work required daily to maintain the dashboard up-to-date, we have constituted a CartONG volunteer task force that supports our efforts. The volunteers are doing an amazing job, meeting online daily, and providing incredibly useful support as our activity is growing. In addition to compiling different internal and external sources, they are also bringing added-value by standardizing and classifying the data in order for any GIS Specialist or Data Manager to be able to analyze it and use it easily to display indicators or create maps.
After having carried out of all this work and taken the time to come up with a stable data model, the MSF GIS Unit has – for the very first time – opened their services publicly as a direct contribution to the work of other humanitarian organizations. As such, the everyday work of our volunteers is therefore also contributing to the global response to the pandemic.
A new dashboard for UNHCR
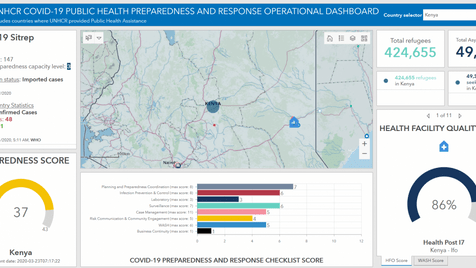
Whilst there are many dashboards out there, visualizing the number of COVID-19 cases across the globe, notably the WHO dashboard and the John Hopkins University dashboard (both referenced internationally), none really addressed the specific needs of the UNHCR Public Health section.
Their team was in fact interested in using the COVID-19 data and having it displayed alongside: i) the organization’s own operational data on the numbers of refugees and asylum seekers as well as ii) public health specific information on WASH and Hygiene preparedness and general Health Facility Quality scores – those being evaluated through mobile data collection and the results being visualized in a web-based application previously built by CartONG.
This new COVID-19 dashboard for UNHCR was built on ESRI technology, with specific interoperability processes which allow reading in data from various data sources. The user can select a country and all related widgets will adjust. Additionally, he/she can also opt to show the assessed health facilities on the map.
And also…
We were also recently contacted through the Accountability Community of Practice (facilitated by the Groupe URD), to support monitoring & evaluation processes for NGOs in the current context. More specifically, there are growing needs to advise humanitarian and development organizations on existing alternatives to face-to-face interviews and on the modalities of implementing data protection principles from remote during the crisis.
Do not hesitate to contact us for similar needs. We will work to pool as much as possible the response to such requests, in particular to avoid duplicating data collection efforts as well as the creation of guidance or visualization tools on the same topics.