Remote Sensing to support an Environmental Impact Assessment in Myanmar
Since April 2020, a team of 3 CartONG volunteers has been supporting our partner, Solidarités International (SI), with the assistance of the CartONG staff team in an Environmental Impact Assessment in Myanmar to provide them with a set of maps produced using remote sensing techniques.
A complex humanitarian context in Kachin State, Myanmar
In 2011, 17 years after the ceasefire agreement, renewed conflict between the Burmese Army and the Kachin Independence Army resulted in the displacement of 100,000 people. In 2020, 97,800 people were still living in nearly 100 camps in Kachin. National and International Humanitarian organizations – including Solidarités International – are working to respond to the basic needs of the vulnerable populations in the camps as well as in the nearby villages also affected by the conflict. This includes in particular access to drinking water, sanitation infrastructures, hygiene promotion, income generating activities, support to farmers and commercial gardening.
Request for support for map production
During a field mission in early 2020, a staff member of CartONG saw the need to map the surroundings of the affected areas of Bhamo and Momauk townships located in Kachin State (northern Myanmar), in support of an Environmental Impact Assessment (EIA) conducted by Solidarités International at the local level. The purpose of this assessment is to measure the vulnerability of the environment and the possible mitigation measures to be considered by SI while implementing WASH (Water, Sanitation and Hygiene) and FSL (Food Security and Livelihoods) activities.
Having worked in the past with INGOs on mapping projects of their working areas, including in Myanmar, CartONG offered SI to technically support their Environmental Assessment through a mapping of the area targeted in the EIA. An announcement was thus circulated among CartONG’s volunteer network, and in April 2020, a team of 3 volunteers – Lucas, Manon and Vincent, all three with skills and a strong interest in remote sensing – started working on this project remotely with support from our staff team.
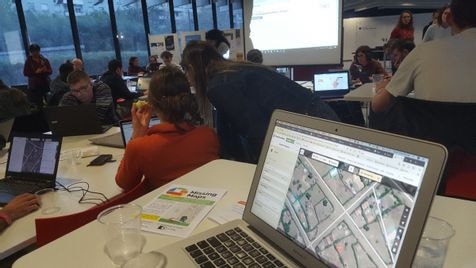
CartONG volunteers regularly use satellite images to produce data manually, notably on OpenStreetMap during mapathons, as illustrated in this first article here and this other one here. But this method is not well suited to land-use mapping. So we decided to test automated remote sensing methods to meet the demand, in addition to the “usual” OpenStreetMap mapping of the area (roads, buildings) done during mapathons.
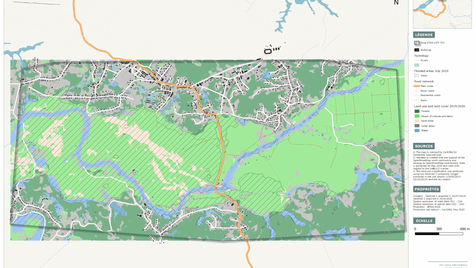
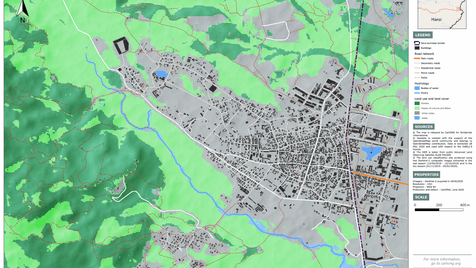
Solidarités International required maps for two different areas. First, the flooded areas in Bhamo township where the organization is implementing FSL activities in support of local farmers. In particular, land cover and land use maps – some of which to specifically show forest cover and/or sandy areas – as well as flood maps were requested to support the organization. In addition, maps were also requested for Momauk township where SI is implementing WASH activities, in particular in the Internally Displaced People (IDP) camps of Lwegel town. For this area, priority was given to land cover and land use maps showing forest, agricultural and urban areas amongst other elements.
A work carried out mostly with open source solutions
Part of the work for the volunteers thus consisted of assessing what types of maps it was feasible to produce in support of SI with the satellite images that were available at the start of the project while considering different remote sensing methods. The initial testing phase conducted by our 3 volunteers covered a wider range of maps than the ones that SI had requested in order to assess the feasibility of producing maps using automated remote sensing methods and to refine the methods they would ultimately use. As such, the volunteers not only look at how to produce maps of land cover and land use and maps of flood zones but also at maps of deforestation, maps of pollution as well as maps illustrating the high human concentration in the targeted areas.
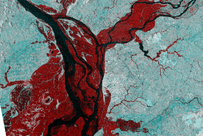
The satellite images used for this volunteer mission come from the Sentinel satellites, a family of Earth observation satellites and instruments of the European Space Agency. They form the space component of the European Union‘s Copernicus program. To date, there are several generations of Sentinel satellites, numbered from 1 to 6. For coverage and land use, the images used by the volunteers come from Sentinel 2, for flooding and deforestation from Sentinel 1 and for pollution assessment from Sentinel 5P.
Throughout this project, CartONG volunteers have mobilized different software by favouring open source tools: in particular, they have worked a lot with the QGIS software. Land use is characterized by a supervised classification under R. As for the floods, they were determined using SNAP and Visan software (as would be maps on pollution for example). This methodology – still under development – thus makes it possible to remotely highlight the realities on the field!

First findings and achievements
A first version of the 5 maps produced for the Bhamo and Momauk townships – including a flood map, two maps of land cover and land use, and two maps showing forest cover and sandy areas – was sent in July 2020 to the Solidarités International team. Manon, Lucas and Vincent are currently reviewing these first versions, adapting them to the changes requested by the partner, including highlighting the perimeters and names of the camps and producing additional larger-scale maps for certain areas.
This experience is interesting for CartONG as the level of technicality required for this type of product meant that we had implemented only a few of them up to now (e.g. this project in support of the ICRC) and exclusively thanks to our permanent team. The few experiments we had conducted on OpenStreetMap land-use mapping in mapathons had not been conclusive, especially since it is difficult to trace it manually with several hands. Coverage and land use data were also not imported into OpenStreetMap as part of this volunteer mission because they did not match the way land use is entered in OpenStreetMap. This project therefore illustrates the wide range of analyses that can be performed with satellite images. It also allows us to link our participatory mapping activities with more advanced GIS tools, thus helping our volunteer and staff teams to improve their skills.
Testimony of Manon – “[Remote sensing is] a theme that appeals to me and attracts me enormously! So, quite naturally, when the project proposed by Solidarités International was launched at CartONG, I went for it! We exchanged a lot with the people involved in the project, and that every day for a period of time! […] The team spirit really took on another dimension in the context of confinement! On a technical level […] I was able to test the handling of Sentinel 1 images, but the most important thing remains the layout of the maps (yes!). Actually, it’s not easy, the color rendering and symbology, finally, it’s very important and the help of the mapping team [from CartONG] has really helped to refine the maps produced”.
Testimony of Vincent – “I have technically progressed a lot in contact with my co-workers. I am always interested in discovering new spaces, in understanding their appropriation by humans, and more simply in a change of scenery. With this project and remote sensing, I was able to explore the Kachin province. Also, it was for me the opportunity to learn how to process data on air pollution, and to become even more aware of the gravity of the situation”.
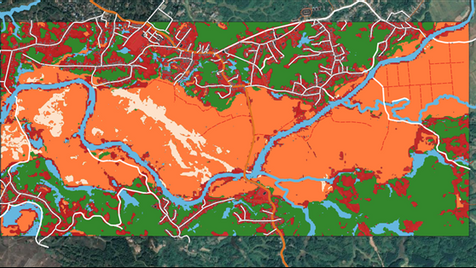
While waiting for the finalized version of all maps, here is an overview of the first results for the map of flooded areas on July 16, 2019 in Bhamo and the map of land cover and land use in Momauk in 2019 – 2020.